The Incident Insight dashboard allows users to compare data across multiple diagrams and projects. For a more in-depth analysis, we can connect to external software, such as Power BI.
To configure your dashboard, follow these steps:
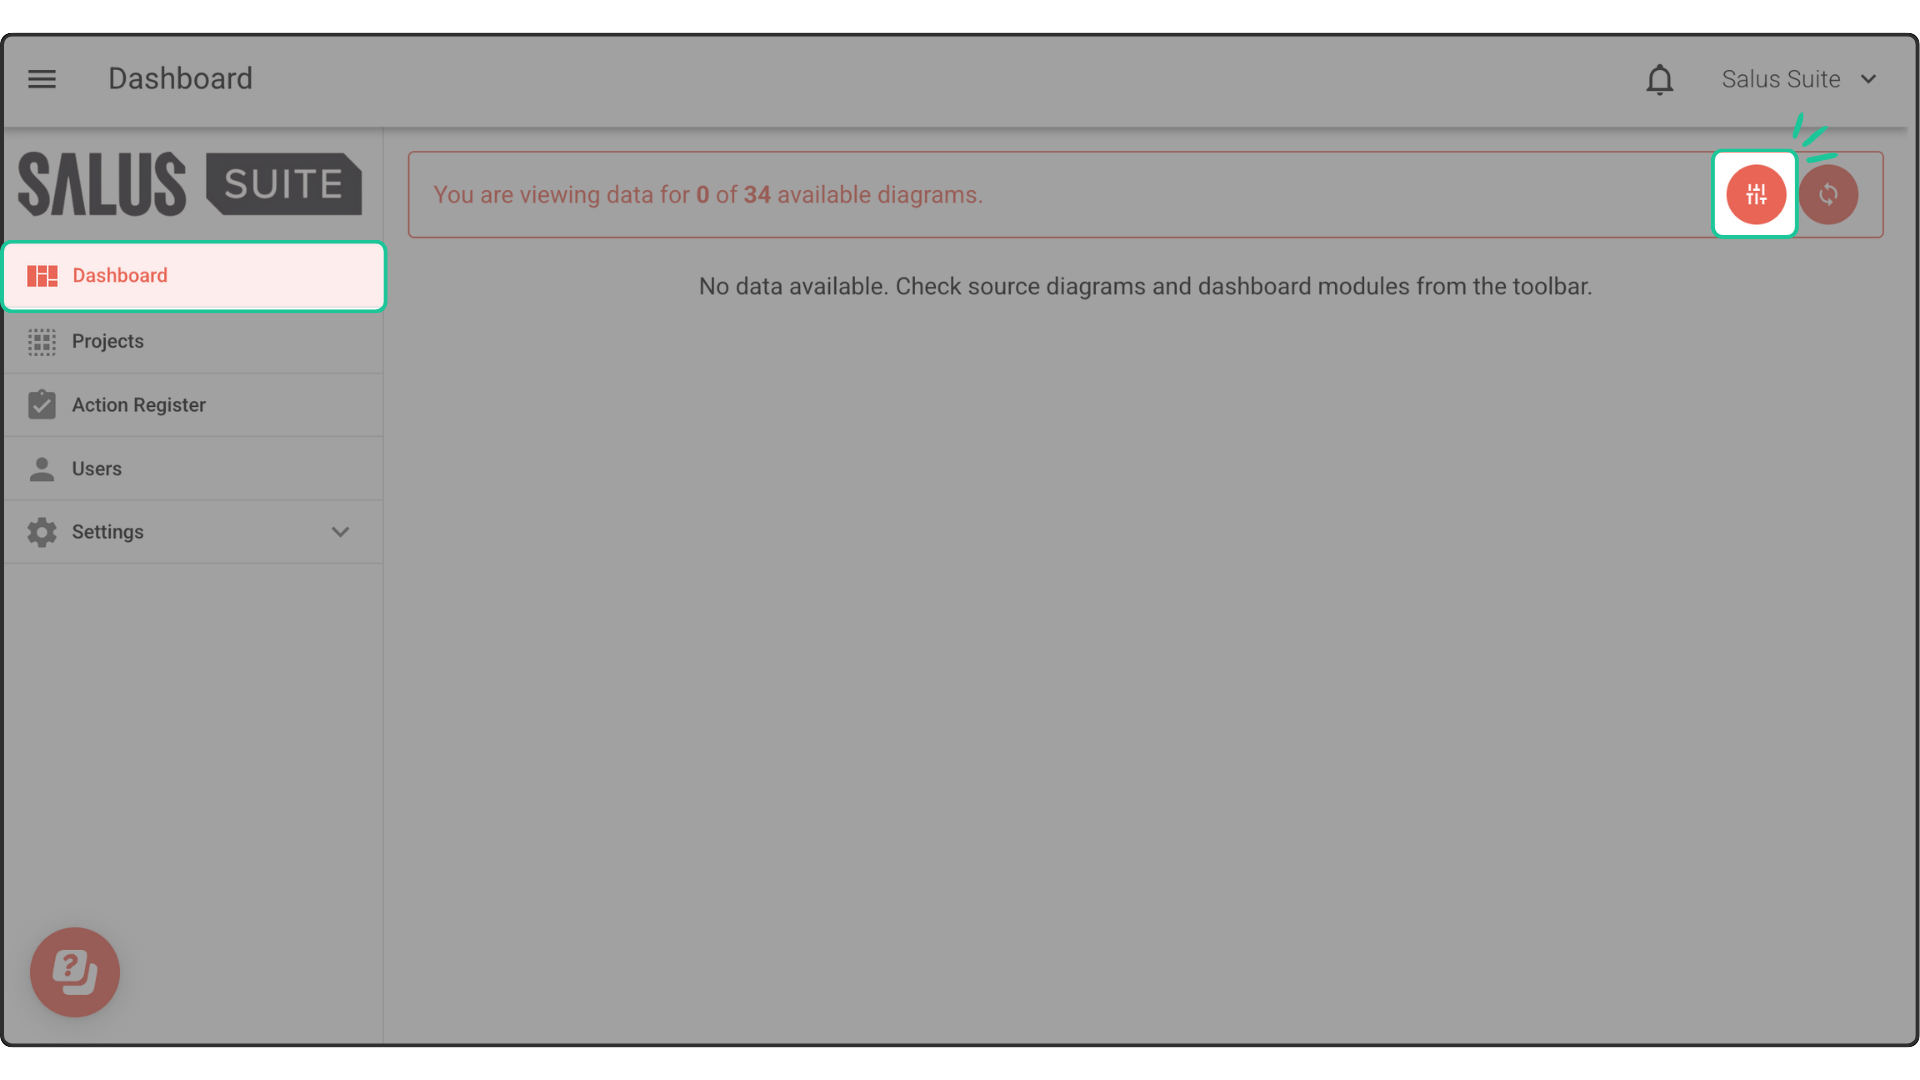
Step 1: Go to the Dashboard Menu.
Step 2: Select the Configure button in the top right corner.
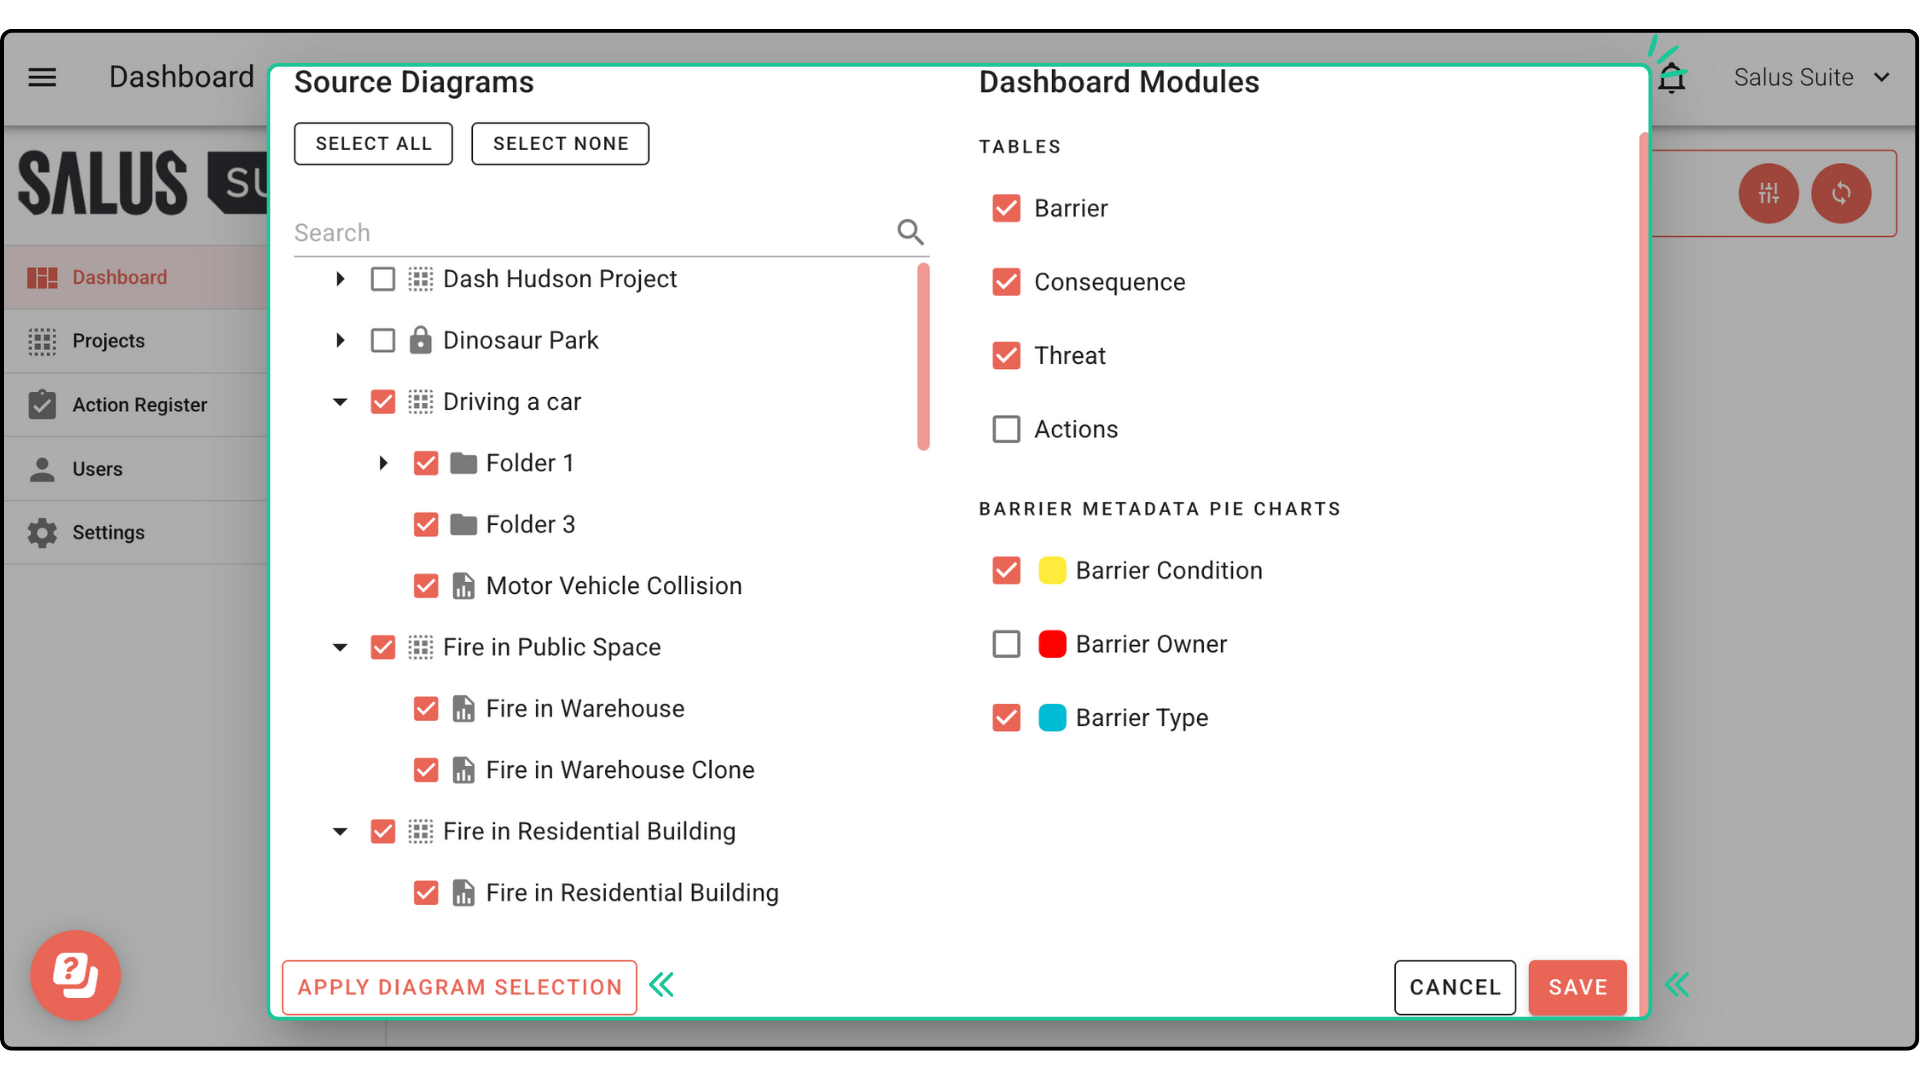
Step 3: In the pop-up, select whole projects or individual diagrams to analyse. Click Apply Diagram Selection. Choose which elements you’d like to display in table format. You can also select which types of metadata you would like to see displayed in pie charts. Press Save.
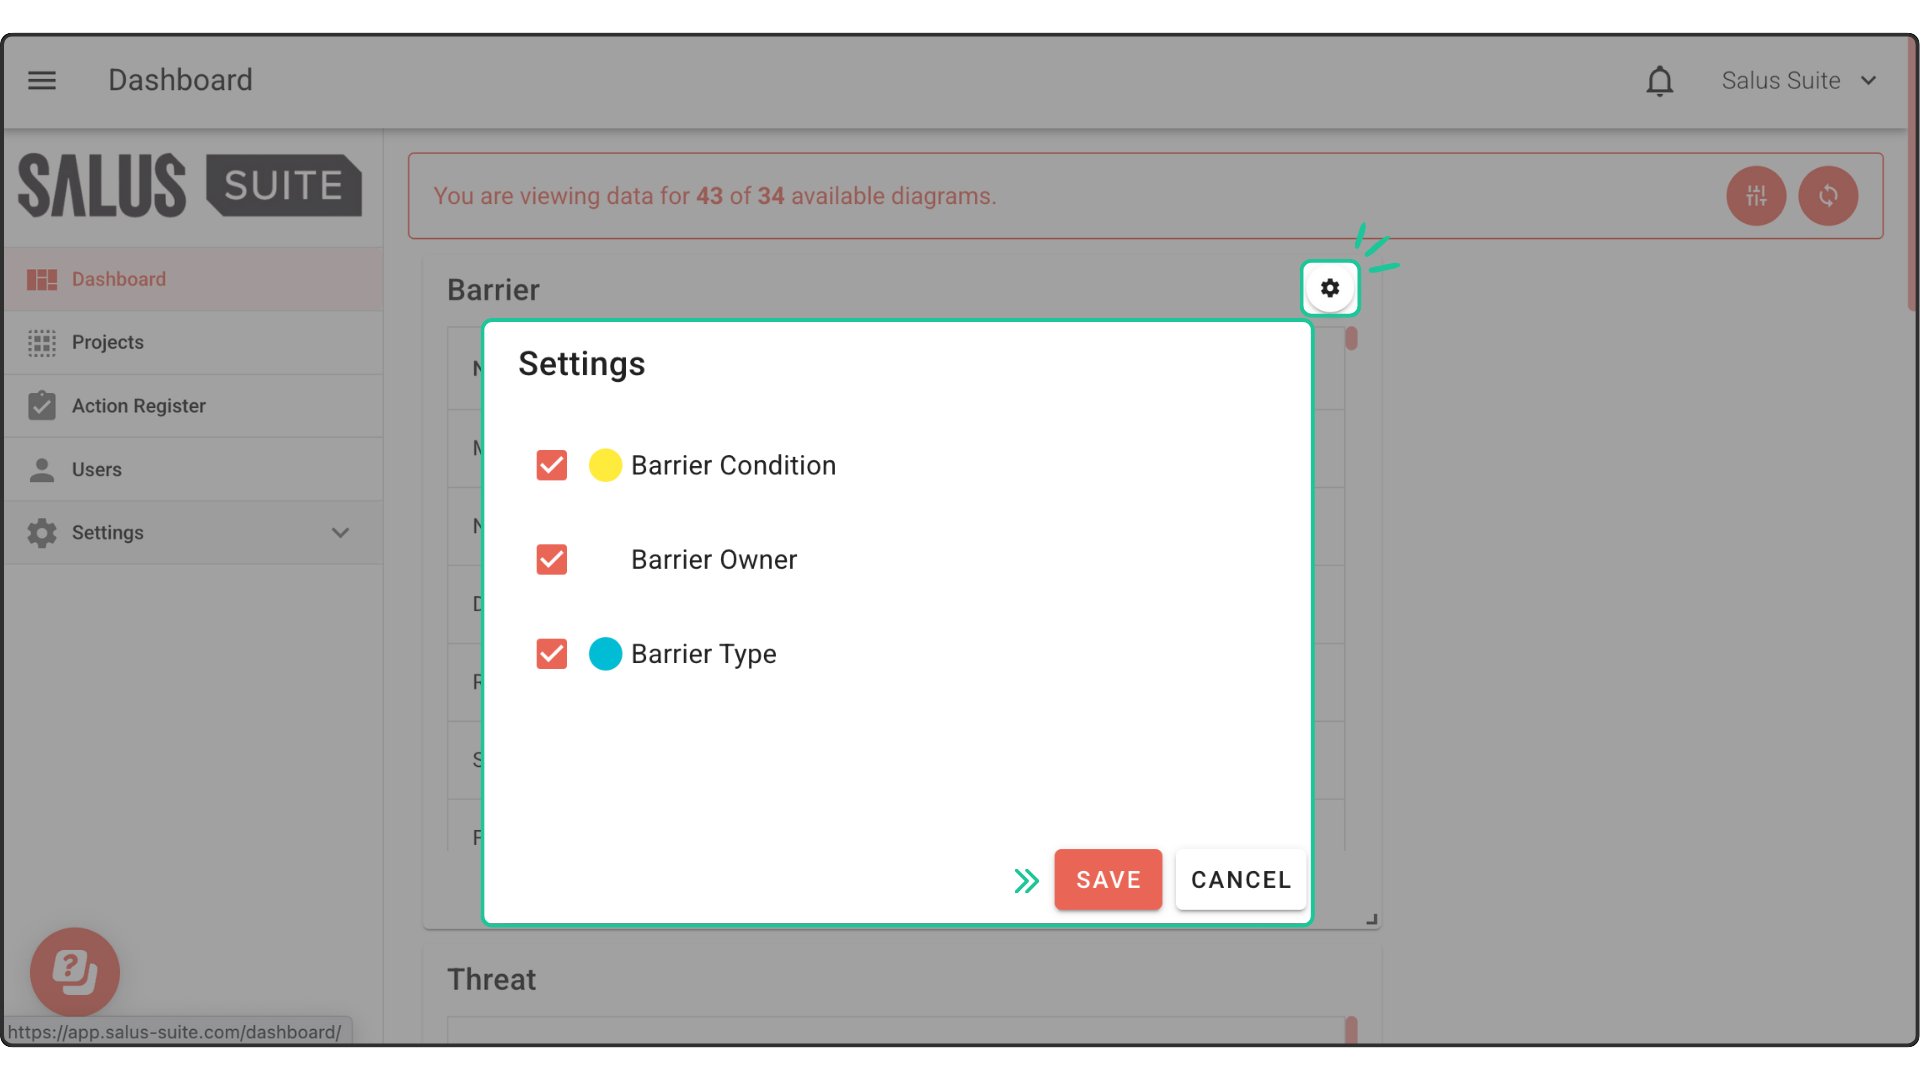
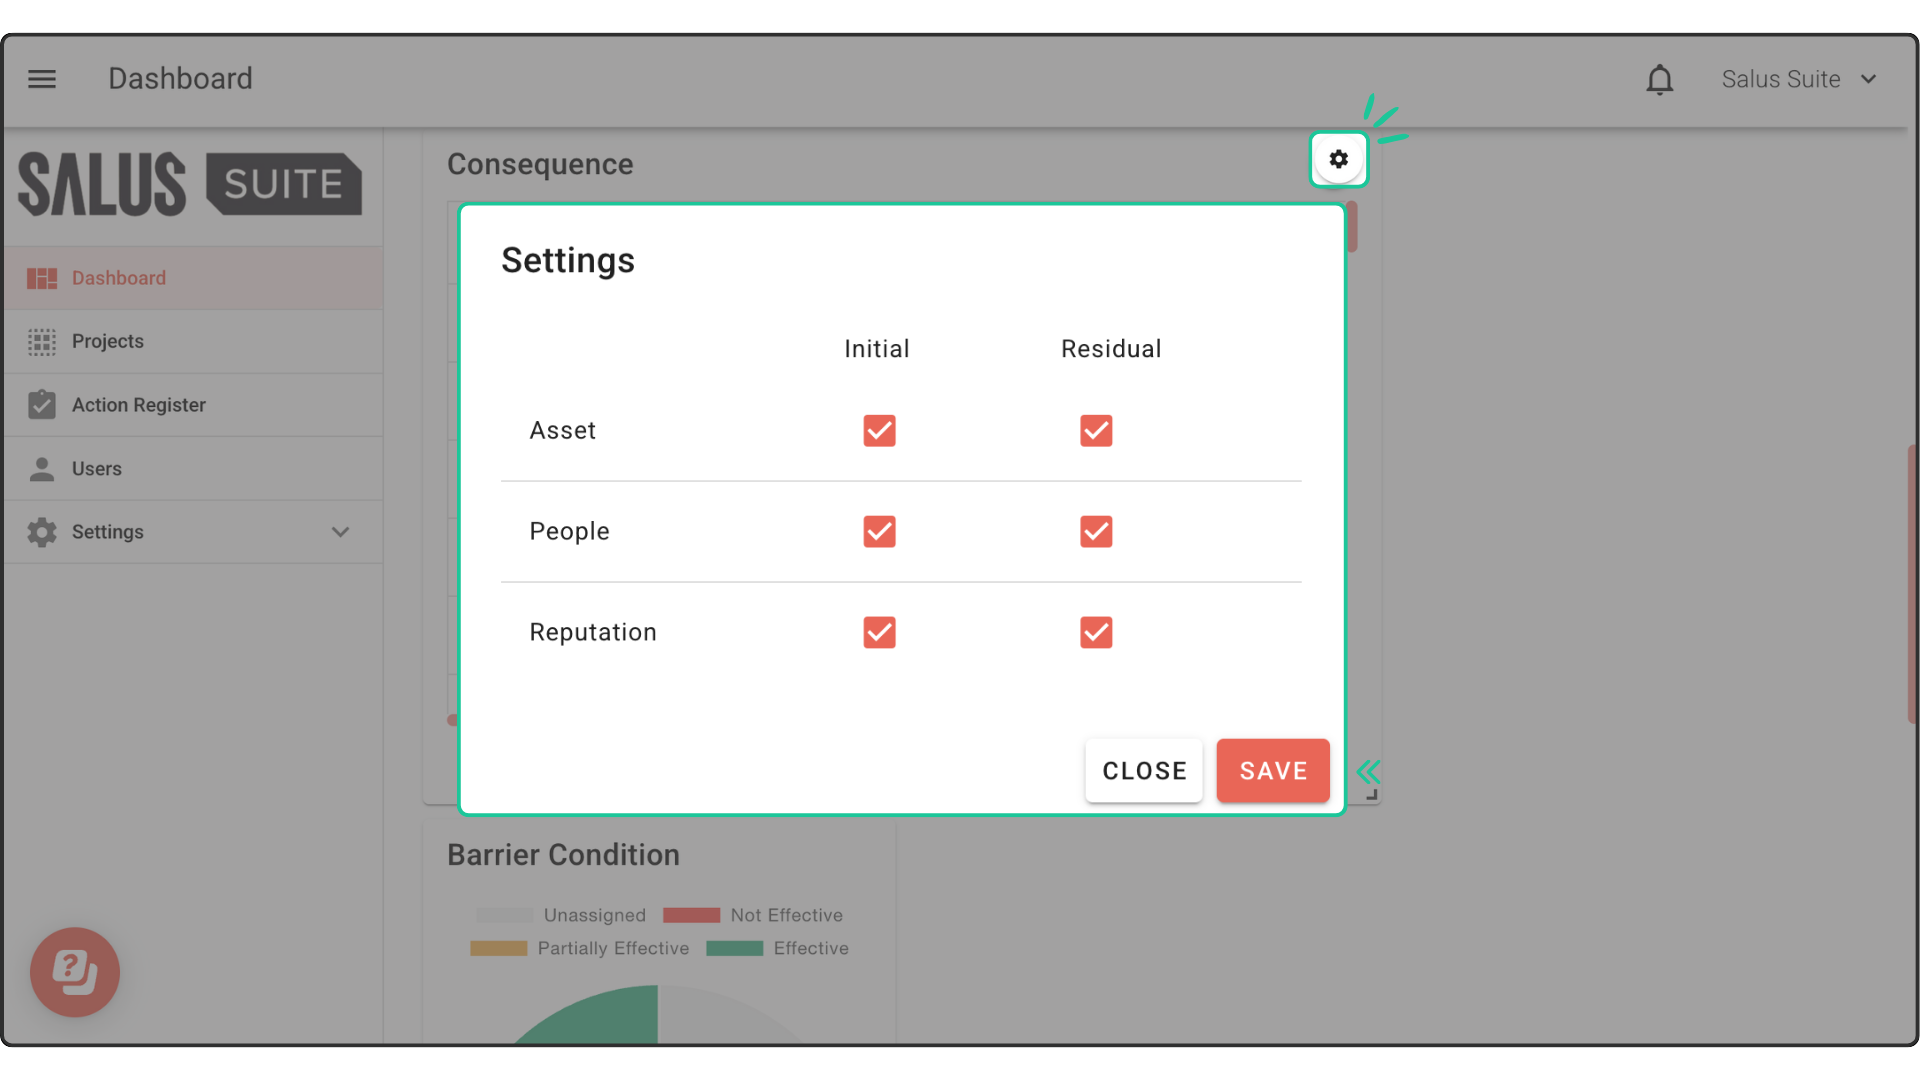
In your dashboard, you can choose to display metadata within the tables. To do so, click the Gear icon on the top right of each table and select the types of metadata you want to be visible.